
Photo by Andrea Piacquadio from Pexels
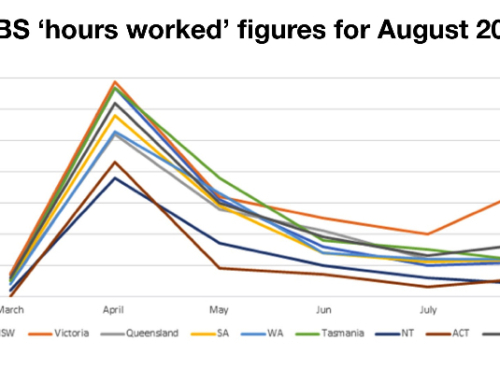
The Australian Bureau of Statistics has released payroll data that shows the drop in the number of payroll jobs on a region by region basis across Victoria.
The payroll data differs from the ABS labour force series, which is based on a decades-long ongoing survey. The payroll survey is much more recent and still considered experimental.
However, payroll data has information on wages, changes in the number of payroll jobs and tracks changes by state, region, industry, sex, age and other criteria.
The current release measures the impact of COVID from mid March to end of May 2020.
Data at the sub-state level such as Statistical Area 4 takes longer to crunch because the survey numbers are so low. The ABS prefers to use a 12-month rolling average for the more traditional labour force series to ensure it is more accurate.
While the labour force data is not good for measuring sudden economic shocks, such as a pandemic, the experimental series based on payroll information provides a more useful and up to date indication of how the pandemic is impacting jobs.
Change in payroll jobs by ABS region in Victoria
| Region | Change between 14 March and 30 May (% Change since 100th case of COVID-19) | Change between 2 May and 30 May (monthly change) | Change between 23 May and 30 May (weekly change) | Change between 16 May and 23 May (weekly change) |
| Warrnambool and South West | -9.40% | -2.40% | 0.20% | -0.30% |
| North West | -9.10% | 1.40% | 0.80% | 0.60% |
| Bendigo | -8.10% | -0.30% | 0.40% | -0.50% |
| Latrobe – Gippsland | -8.10% | 0.30% | -0.30% | 0.10% |
| Geelong | -7.90% | 0.10% | 0.50% | -0.40% |
| Shepparton | -7.60% | 0.60% | 0.70% | 0.50% |
| Ballarat | -7.30% | 0.30% | 1.00% | -0.50% |
| Hume | -6.80% | 1.00% | 0.40% | 0.20% |
| Melbourne – Inner | -10.60% | -1.00% | 0.10% | -0.30% |
| Melbourne – North West | -9.40% | -1.40% | -1.00% | -0.20% |
| Melbourne – North East | -9.00% | -1.80% | -0.90% | -0.20% |
| Melbourne – West | -8.40% | -0.90% | -0.30% | -0.20% |
| Melbourne – Inner East | -8.00% | -0.70% | 0.00% | -0.20% |
| Mornington Peninsula | -7.70% | 0.30% | 0.60% | -0.10% |
| Melbourne – Inner South | -7.50% | 0.10% | 0.60% | -0.20% |
| Melbourne – South East | -7.40% | -0.20% | 0.30% | 0.00% |
| Melbourne – Outer East | -6.80% | 0.40% | 0.60% | -0.30% |
| Victoria | -9.00% | -0.40% | 0.10% | -0.10% |
What the data shows
The first column is the most important at this stage (impact since 100th case of COVID in mid March)
For rural and regional Victoria:
- Warrnambool South West and North West experienced jobs falls of just under 10 per cent between the start of the COVID emergency and end of March, decreasing by 9.4 per cent and 9.1 per cent respectively. Both these declines were above the state average of 9 per cent.
- Warrnambool and South West includes Colac-Otway (S) Corangamite (S) Glenelg (S) Moyne (S) Southern Grampians and Warrnambool (C)
- North West includes Ararat, Buloke (S,) Gannawarra (S), Hindmarsh (S), Horsham (RC),Mildura (RC), Northern Grampians (S), Swan Hill (RC), West Wimmera (S) and Yarriambiack (S).
- Bendigo and LaTrobe Gippsland both experienced job falls of 8.1 per cent. The Bendigo SA4 consists of Loddon, Greater Bendigo, Mount Alexander Shires and half of Macedon Ranges Shire. LaTrobe Gippsland consists of East Gippsland, Wellington, La Trobe, Baw BAw, SOuth Gippsland and Bass Coast Shires.
- Jobs in Geelong SA4 fell by 7.9 per cent, covering the CIty of Greater Geelong and the Surf Coast Shire, as well as half of Golden Plains Shire.
- Shepparton and Ballarat SA4s had job declines of 7.6 per cent and 7.3 per cent respectively. Shepparton SA4 consists of the City of Greater Shepparton, and the surrounding shires of Campaspe and Moira, Ballarat encompasss the CIty of Ballarat and the Central Goldfields, Moorabool, Hepburnm, Pyrenees Shires and the other half of the Golden Plains Shire.
- The SA4 of Hume had the lowest jobs fall of all the non metropolitan SA4s, declining by 6.8 per cent. This SA4 includes the Rural Cities of Wangaratta and Benalla, the CIty of Wodonga and the Murrindindi, Indigo, Mansfield, Strathbogie and Mitchell Shires.
The data is in keeping with an earlier analysis by Grattan Institute which has the country Federal electorates of Wannon and Mallee among the worst affected: see https://blog.grattan.edu.au/2020/06/the-latest-jobs-data-shows-urban-electorates-are-now-being-hit-hardest-by-covid-19/
Why are the rural numbers so bad?
On top of the services industries jobs that disappeared, a large number of agriculture employment was also lost.
What happened in Metropolitan Melbourne?
- Inner Melbourne experienced the greatest decline in jobs to the end of March, out of any region in Victoria, falling by more than 10 per cent. This was followed by Melbourne north west (9.4 per cent), and Melbourne north east (9 per cent). These falls reflect the number of accommodation and food services and retail trade businesses based in these areas, and which were most immediately impacted by the crisis.
- Outer South East Melbourne local government areas and areas in the Eastern Region Group were less affected by COVID-19 at this early stage. However, as the crisis rolls on, other industries such as professional services and construction may suffer falls in the number of people in jobs.